Thursday, January 3, 2013

Chapter 2.2

Identifying Polynomial Graphs:
-First things first- the graph of a polynomial function is continuous, meaning it has no breaks, holes, or gaps. Also, it only has soft, round turns- no sharp, pointed turns. By sticking to this defintion, you should be able to distinguish a polynomial graph!

-Polynomials can have up to many degrees, but here are some of the basics so you can get a feel for them:


0 degree

1 degree

2 degree


3 degree

4 degree

5 degree

-As you may notice, every odd polynomial has at least one x-intercept, and the degree number is the maximum number of x-intercepts that polynomial can have.
-The maximum number of Relative Extrema for each polynomial is the degree number minus one (n-1)

-Now we will discuss a little bit about end behavior. When you have an even function, the ends of the graph will be doing the same thing, and when you have an odd function, the ends of a graph will be doing opposite things. But what are the ends of the graph defind as?
        -Left end: x approaches negative infinty
        -Right end: x approaches postive infinity


Now we have gone over the basic things of polynomial functions, let's move on to:

LIMIT NOTATION:
  This is read: "The limit of f(x) as x approaches (negative/positive) infinity"
The infinity symbols on the picture can be replaced with either negative or positive infinity depending on your graph.

So, how do we use this?
Well, let's take a polynomial F(x)= -73x^7+2x^3+5
 You can take a few routes:
       -Plug in a number as close to infity as you can, and see what happens when that number is   negative and positive to see what happens as x approaches negative or postivie infinity.
       -When the leading coefficient (the one with the highest degree) is so much bigger than the other numbers that the other numbers don't take much of an effect, you can focus on the leading coefficient.
                   -If the leading coefficient is negative, you know that: as the limit of f(x) as x approaches infinity, the graph decreases, or f(x) goes to negative infinity. Knowing then that the graph is odd, the left end (as x approaches negative infinity), f(x) will be increasing towards infinity. If the graph was even, the left and right end would be doing the same thing.

So that's basically it- identifying polynomials and being able to use limit notation. If more help is needed, feel free to visit the video:

 And one things the book mentions:
Intermediate Value Theorm:
Let a and b be real numbers such that a<b If f is a polynomial function such that f(a) does not equal f(b), then in the interval [a,b], f takes on every value between f(a) and f(b).
This is a way to help locate real zeros of a polynomial function!

-Maggie


Saturday, December 29, 2012

Monday, December 10, 2012

Chapter 1.3

Lesson 1.3- Shifting, Reflecting, and Stretching Graphs!

Graphs of Common Functions:

The six most commonly used functions in algebra are as follows:

  1.  Constant: 

2) Identity:


3) Absolute Value:


4) Square Root:


5) Quadratic:


6) Cubic:


Rigid Transformations:

Rigid Transformation- type of graph transformation that does not alter the basic shape of the graph in anyway, leaving the basic shape unchanged.

Vertical and Horizontal Shifts:

The first common type of graph transformations are shifts. Shifts are rigid transformations.

Depending on the placement of a number will determine if it shifts the graph vertically or horizontally and its sign will determine which direction it will go. 
If c is a positive real number than...
 the graph is shifted c units upward
 the graph is shifted c units down
 the graph is shifted c units right
 the graph is shifted c units left    *Note: when c is inside parenthesis it shifts graphs in the opposite direction that what would be assumed. 

Reflecting Graphs:

the second common type of graph transformations are reflections. Reflections, like shifts, are also rigid transformations

When a negative sign is present in front of x or f(x), the graph will reflect over the opposite axis. Therefore...

 
represents a reflection in the x-axis
 represents a reflection in the y-axis

Nonrigid Transformations- 

Vertical Stretches and Compresses

Because vertical stretches and compresses are nonrigid transformations, they cause distortions or changes in the shape of the original graph. Vertical stretches and compresses only appear as the value in front of f(x).

 the graph is vertically stretched by multiplying all y values by c

 the graph is vertically compressed by multiplying all y factors by (1/c)


Thursday, December 6, 2012

Translating Math to English

 \[x_{1}\] is x with 1 as a subscript and  \[x_{2}\] is x with 2 as a subscript

For a lot of people, math is sometimes hard to understand. For people like me, math is always hard to understand. If you're like me, and don't understand mathematics, it is probably because mathematicians devote their lives to finding ways to confuse and deceive non-mathematicians. This does not mean, however, that you cannot understand mathematics. By simplifying the language in math, you can suddenly understand much more than you previously thought you could. Here are some examples of translating math to English:

Math talk: A function f is increasing on an interval if, for any \[x_{1}\] and  \[x_{2}\] in the interval, \[x_{1}< x_{2}\] implies \[f(x_{1})< f(x_{2})\].

Wow. Sounds tricky, doesn't it? But that is only because of the way it is written. If we break it down, we can understand the meaning. First, we should say that an interval is a section of a graph.  Now let's look at " for any \[x_{1}\] and  \[x_{2}\] in the interval, \[x_{1}< x_{2}\] ". This simply means that there are two x-values on a graph, and one of those values lies to the left of(is less than) the other point. Now for "  \[f(x_{1})< f(x_{2})\] ".  This means that the y-value that corresponds to the x-value on the left is below(less than) the y-value that corresponds to the x-value on the right. An x and y value make a point. So one point is to the left of and below the other. In the end, we get this " A function is increasing at a certain section if, in that section, any point that is to the left of another point is also below that point."

Peace bro-
Andrew Geller


Difference Quotients

A difference quotient is typically thought of to be just an equation, but it is simply a more complex variation of the slope formula.

The equation for a difference quotient is: 


In class, we derived this formula.  The picture below shows a slight variation of how this formula may be derived.  The difference quotient can be used to find the slope of individual portions of graphs of polynomial or exponential functions.  As you can see, if you use the basic slope formula given the values of x and y (x,f(x)) and (x+h,f(x+h)), the simplified result is the difference quotient.


Caution:When solving difference quotient problems, never try to set anything equal to zero; it is only an expression.


Here are a few example problems of how to solve difference quotient problems given a function f(x):


And with a polynomial function:


Have a great day!!!!! Julia Wilkins


Tuesday, December 4, 2012

Functions and Their Graphs: 1.1 - Functions

A function is relationship involving one or more variables. Functions have an input and output. The input is the first coordinate of the ordered pair and the output is the second coordinate. In the example below, the input values are a, b, c, and d, and the output values are p, q, and r.

Note the following characteristics of the function above that will apply to other functions:    
(1) Each element in A is paired with an element of B
(2)  Some elements in B may not be paired with any element in A
(3)  Two or more elements of A may be matched to the same element of B
Also, if an element of B were to be paired with two elements of A, then the picture would not represent a function.
i.e.                 a-->p                                   a-->p
                                              b -->q                                 b-->q
                                              b-->r                                   c-->q
                                              c-->p                                  d-->r
                                    NOT A FUNCTION                 FUNCTION


Functions must pass the vertical line test:
Function Notation is just a way to represent that the equation is a function.


To evaluate a function, you must enter the input value into the output, and then solve. This next example shows the evaluation of g(x)= 3/(10-7x) for the solution of x when we have g(x)=g(2):


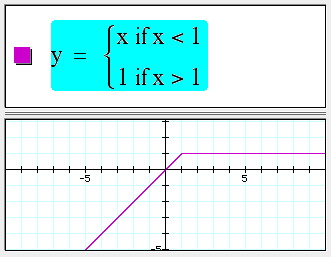
A Piecewise-Defined Function is simply a function in Piecewise Form, which may sound confusing, but the main idea is shown below (the lines show the solutions to the function):


Videos to help find Domain of functions:

The domain is all values of the independent variable for which the function is defined.


Difference Quotient: